Data Conveyer Tutorial
Lesson 5: Limits and Errors
This lesson assumes that you have completed Lesson 4 of this Tutorial. It is expected to take about 5 minutes.
There are many ways to control Data Conveyer process and its completion status. In this lesson, we will examine some of them.
Step 5.1 Add the following line to the OrchestratorConfig object initializer near the top of the Main method:
IntakeRecordLimit = 180,
Step 5.2 Select Debug → Start Debugging (F5) to build and execute the project. You will see output like this:
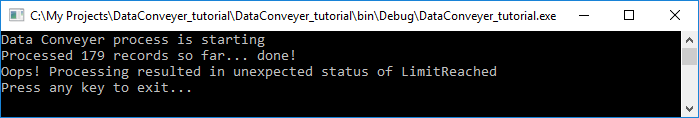
You may be curious why Data Conveyer stopped after processing 179 records, and not 180 records. This is because of the header row, which is included in the record limit, but not in the count of rows processed. You can confirm this by changing the HeadersInFirstInputRow setting from true to false, in which case the 180 records will be reported (note though that after doing so, Data Conveyer will be unable to properly determine field names and therefore its output will be incorrect).
Step 5.3 Add another setting to the OrchestratorConfig object initializer near the top of the Main method:
TimeLimit = TimeSpan.FromSeconds(1.5),
Step 5.4 Select Debug → Start Debugging (F5) to build and execute the project. You will see output similar to this screen:
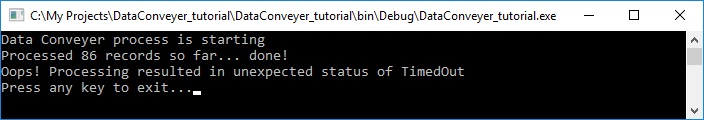
Feel free to experiment with different values for these 2 limit settings (IntakeRecordLimit and TimeLimit) to see that Data Conveyer will stop processing upon hitting one of them, whichever comes first.
Now, let’s see what will happen if an error occurs in the code we supplied to Data Conveyer.
Step 5.5 In the TransformRecordToSayHello function, add the following line immediately before the return statement:
if (recordIn.RecNo > 42) throw new Exception("Simulated problem occurred");
Step 5.6 Select Debug → Start Debugging (F5) to build and execute the project. Your output will look like this:
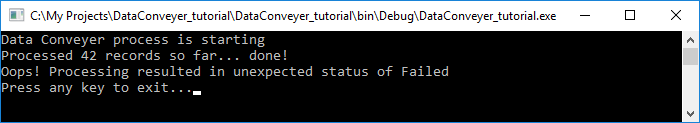
Depending on the Visual Studio Exception settings, you may experience the execution entering debugger when the exception is thrown. In this case, you can simply Continue (F5) to resume processing. Alternatively, in order to avoid entering debugger, you can adjust the Visual Studio Exception settings (e.g. check “Continue when unhandled in user code” for System.Exception).
On slower systems, it is possible for the process in this step to result in a status of TimedOut (like in step 5.4) instead of Failed. If this happens, the TimeLimit value (set in step 5.3) can be increased or the setting removed altogether.
Step 5.7 Replace the line that constructs the OrchestratorConfig object (var config = new OrchestratorConfig()) near the top of the Main method by the following line:
var config = new OrchestratorConfig(LoggerCreator.CreateLogger(LoggerType.LogFile, "Sample process from the tutorial", LogEntrySeverity.Information))
The above statement requires a using Mavidian.DataConveyer.Logging; directive. Add it to the top of the Program.cs module.
This added constructor parameter will cause Data Conveyer to send logging information to a DataConveyer.log file located in the same folder as the Data Conveyer executable (such as the bin\Debug\ subfolder of the project).
Step 5.8 Select Debug → Start Debugging (F5) to build and execute the project.
Locate the DataConveyer.log file (e.g. in the bin\Debug\ subfolder of the project) and examine its contents. It will look similar to:
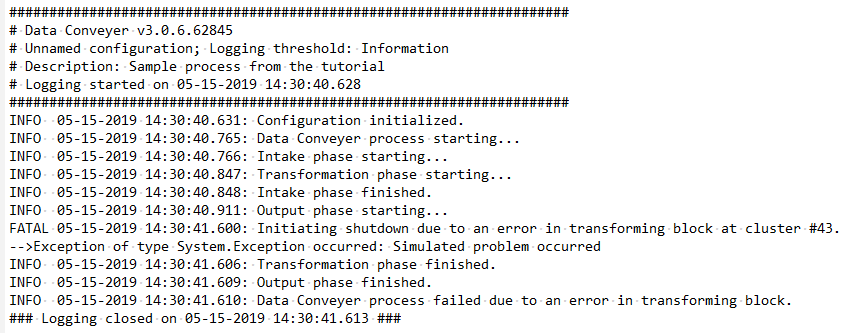
Note the log entry prefixed with FATAL, which reveals the underlying reason behind the Failed completion status (“System.Exception”, “Simulated problem occurred”) along with its context (offending code block: transforming block, i.e. RecordboundTransformer; offending data record: cluster #43).
End of Lesson 5 and the Tutorial.